
Collaboratively mapping and understanding communities
Fully GDPR - Compliant:
Maps are built with consent, not surveillance,
and participants own their data.
“The short mapping session showed us where priorities were shared, ideas for potential collaborations, and how we can support each other's work. Now we have a shared language and set of references that gets us moving in the same direction faster.”
— Simon Lock, West of England Music & Arts
For those supporting, building or resourcing communities, there are challenges:
The community could benefit from taking more agency and distributing leadership across the network.
Long term power dynamics are blocking community energy and initiatives.
There’s a need to build more collaborations across the whole network.
The community needs strengthening, but large events aren’t helping.
It takes more than a database to track complex community behaviours.
People hesitate to start new initiatives because they don’t know whats already in place.
With the Relational Mapping Toolkit, it’s different:
Members of your community can input their data via a simple webform, and immediately see themselves in a network map. The video below shows how the information is added into the system and how it is displayed.
This is crowdsourced data: we run workshops in which people get together to answer 10 questions on a simple web form. As they do so, they create a dynamic node map of their community in real time
- and it takes less than an hour.

How it Works
1: You meet with us to talk through your community journey and how a map can support it.
2: We design the question set and analyses that ensure the map will gather and display the data in exactly the right way to meet the brief.
3: You book us to run the mapping workshop, or we help you run your own.
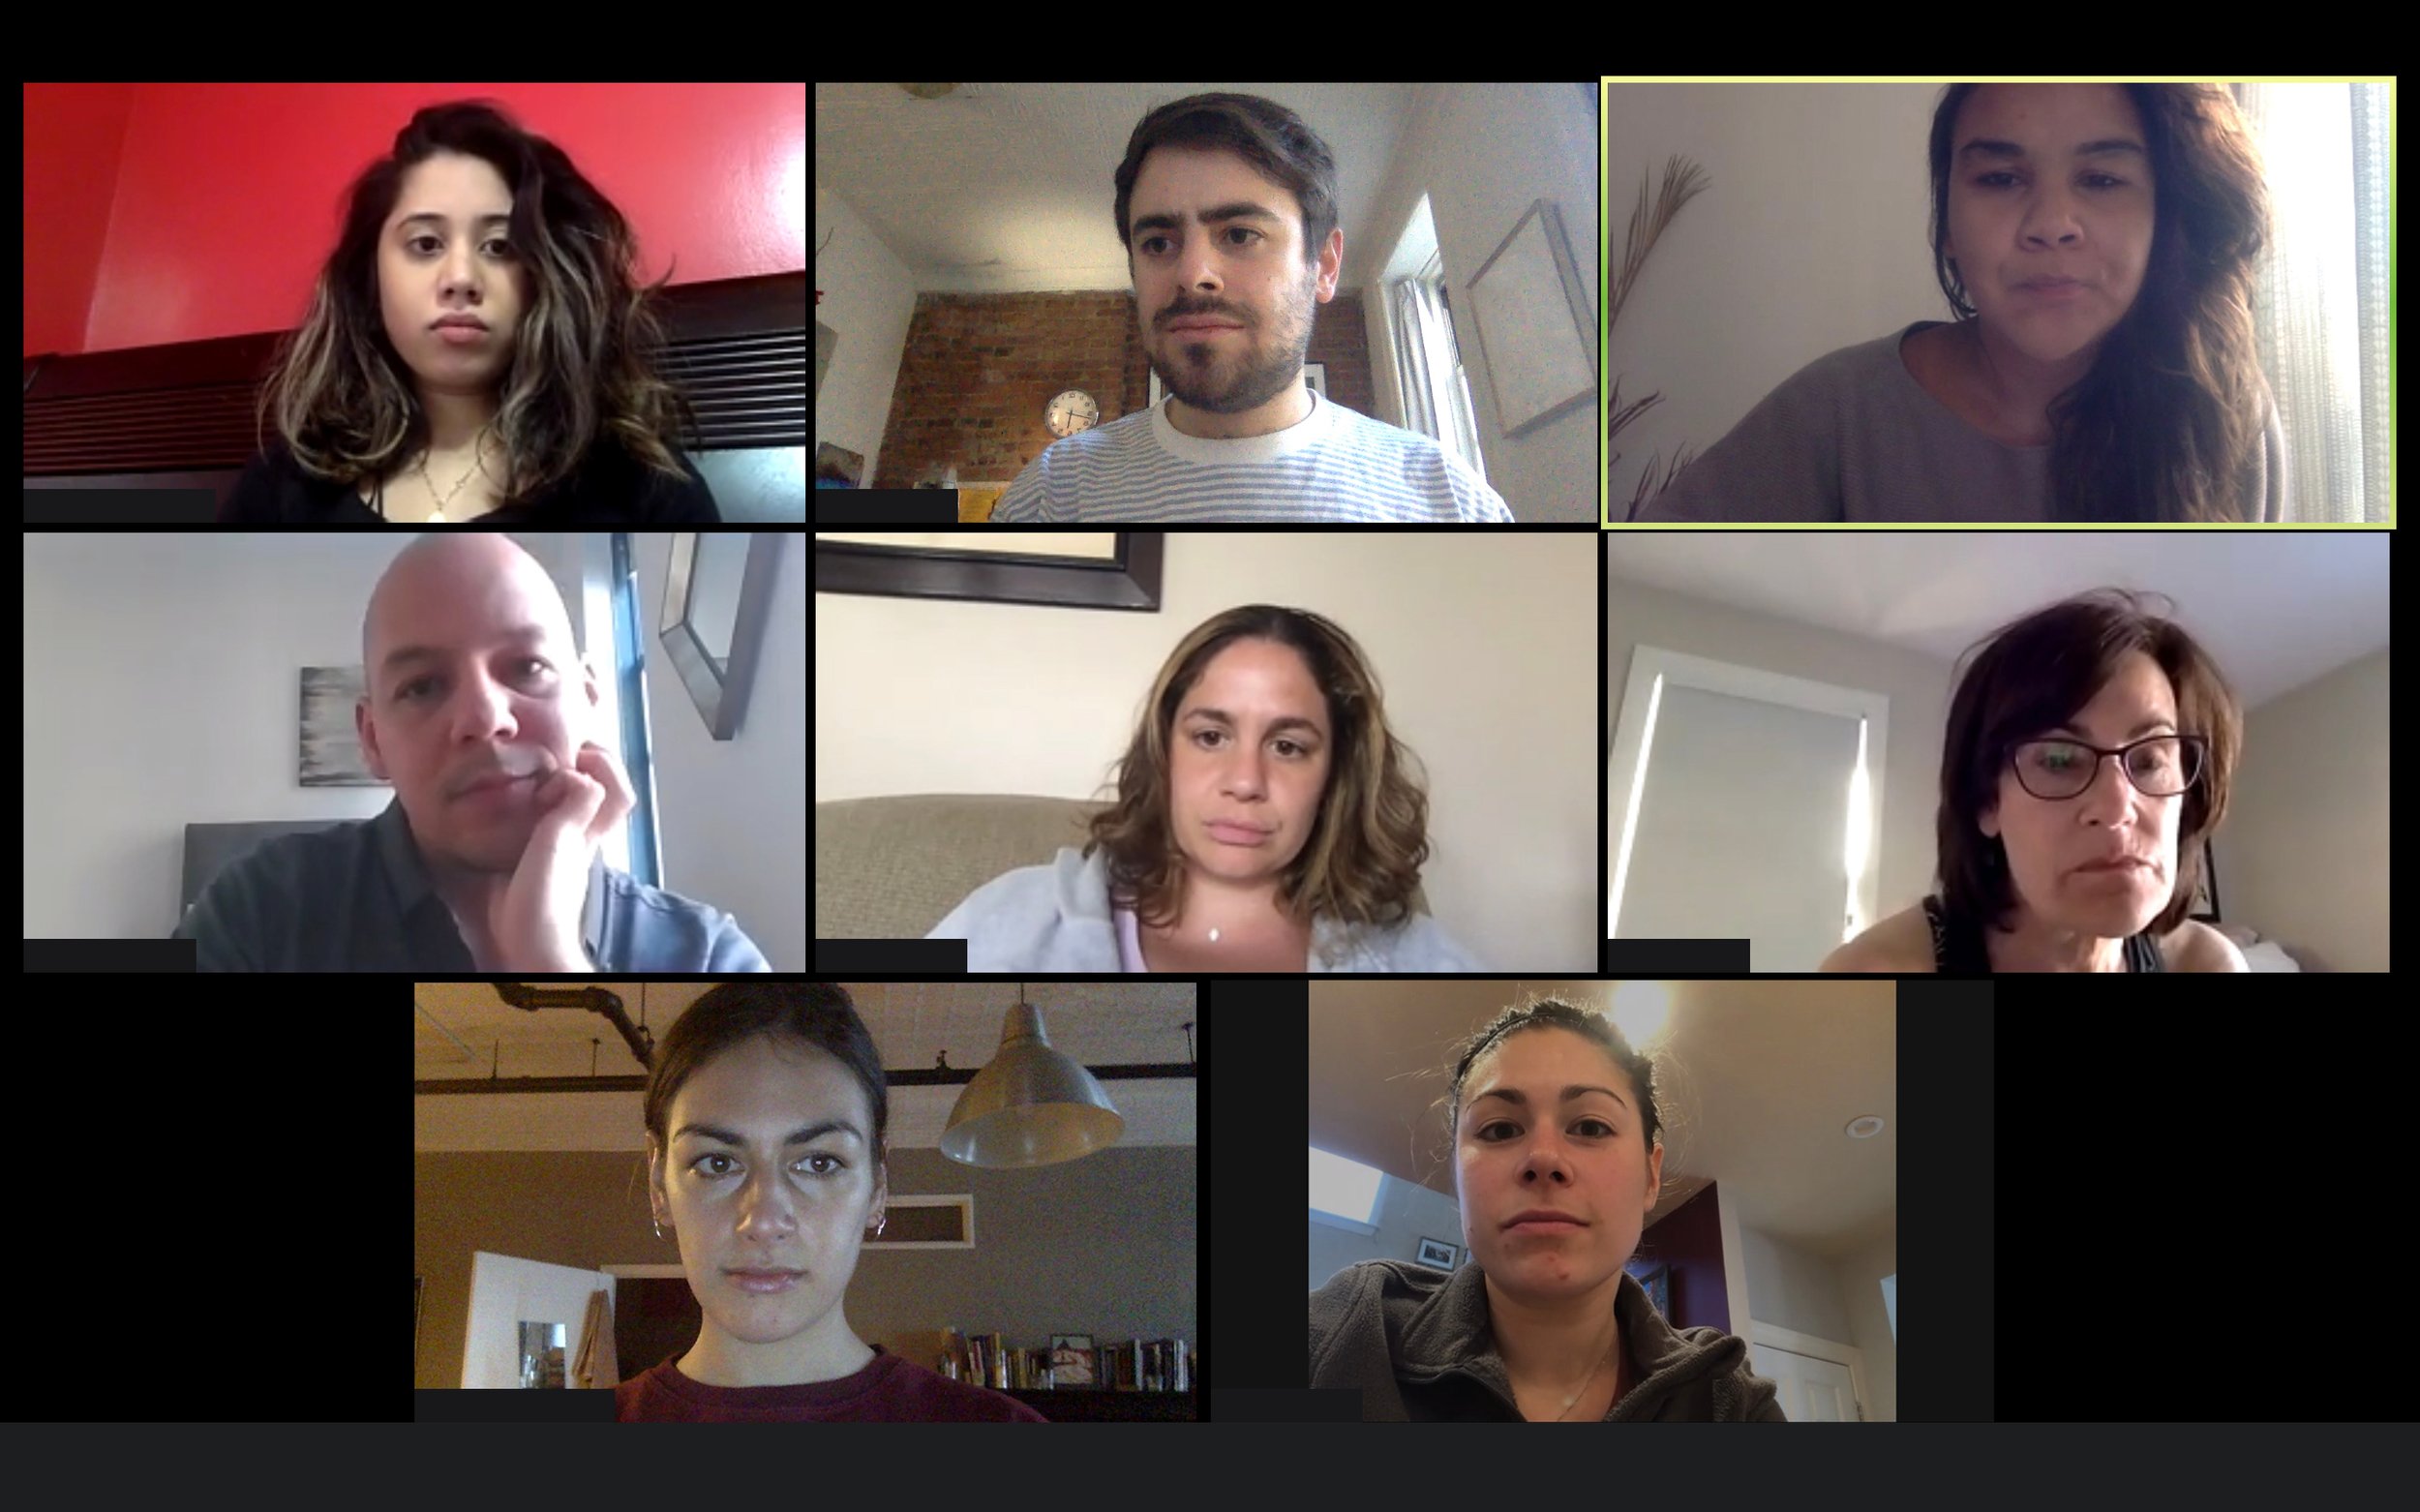
4:The community gathers in real life or on videoconference to fill in the 10 question form and the live network map builds in real time.
5: Everyone leaves with insights, evidence, a shared story, and a map your community owns.
The process takes 4 weeks and you can run the process as many times as you like from Step 3
to build more people and organisations into the map as needed.
985
Participants
7
Regions
43
Workshops
We mapped 109 organisations building alternative futures across the UK for JRF as part of a research project run by the Onion Collective
We mapped 65 grantees and 18 delivery partners under the Culture West programme, looking at change over time in relational strength between 2023 and 2026.

We mapped 77 grantees across the MyWorld funding programme, looking at how collaborations and funding ripple across the network over time.
Who are we?
The Relational Mapping Toolkit is a product from the Free Ice Cream team. Free Ice Cream are a participatory design studio with 10 years experience designing and delivering community mapping tools, installations and playful invitations into participation.